Analyzing Inventory with the Stock Module
Your hub for real-time stock levels, value analysis, and inventory health metrics.
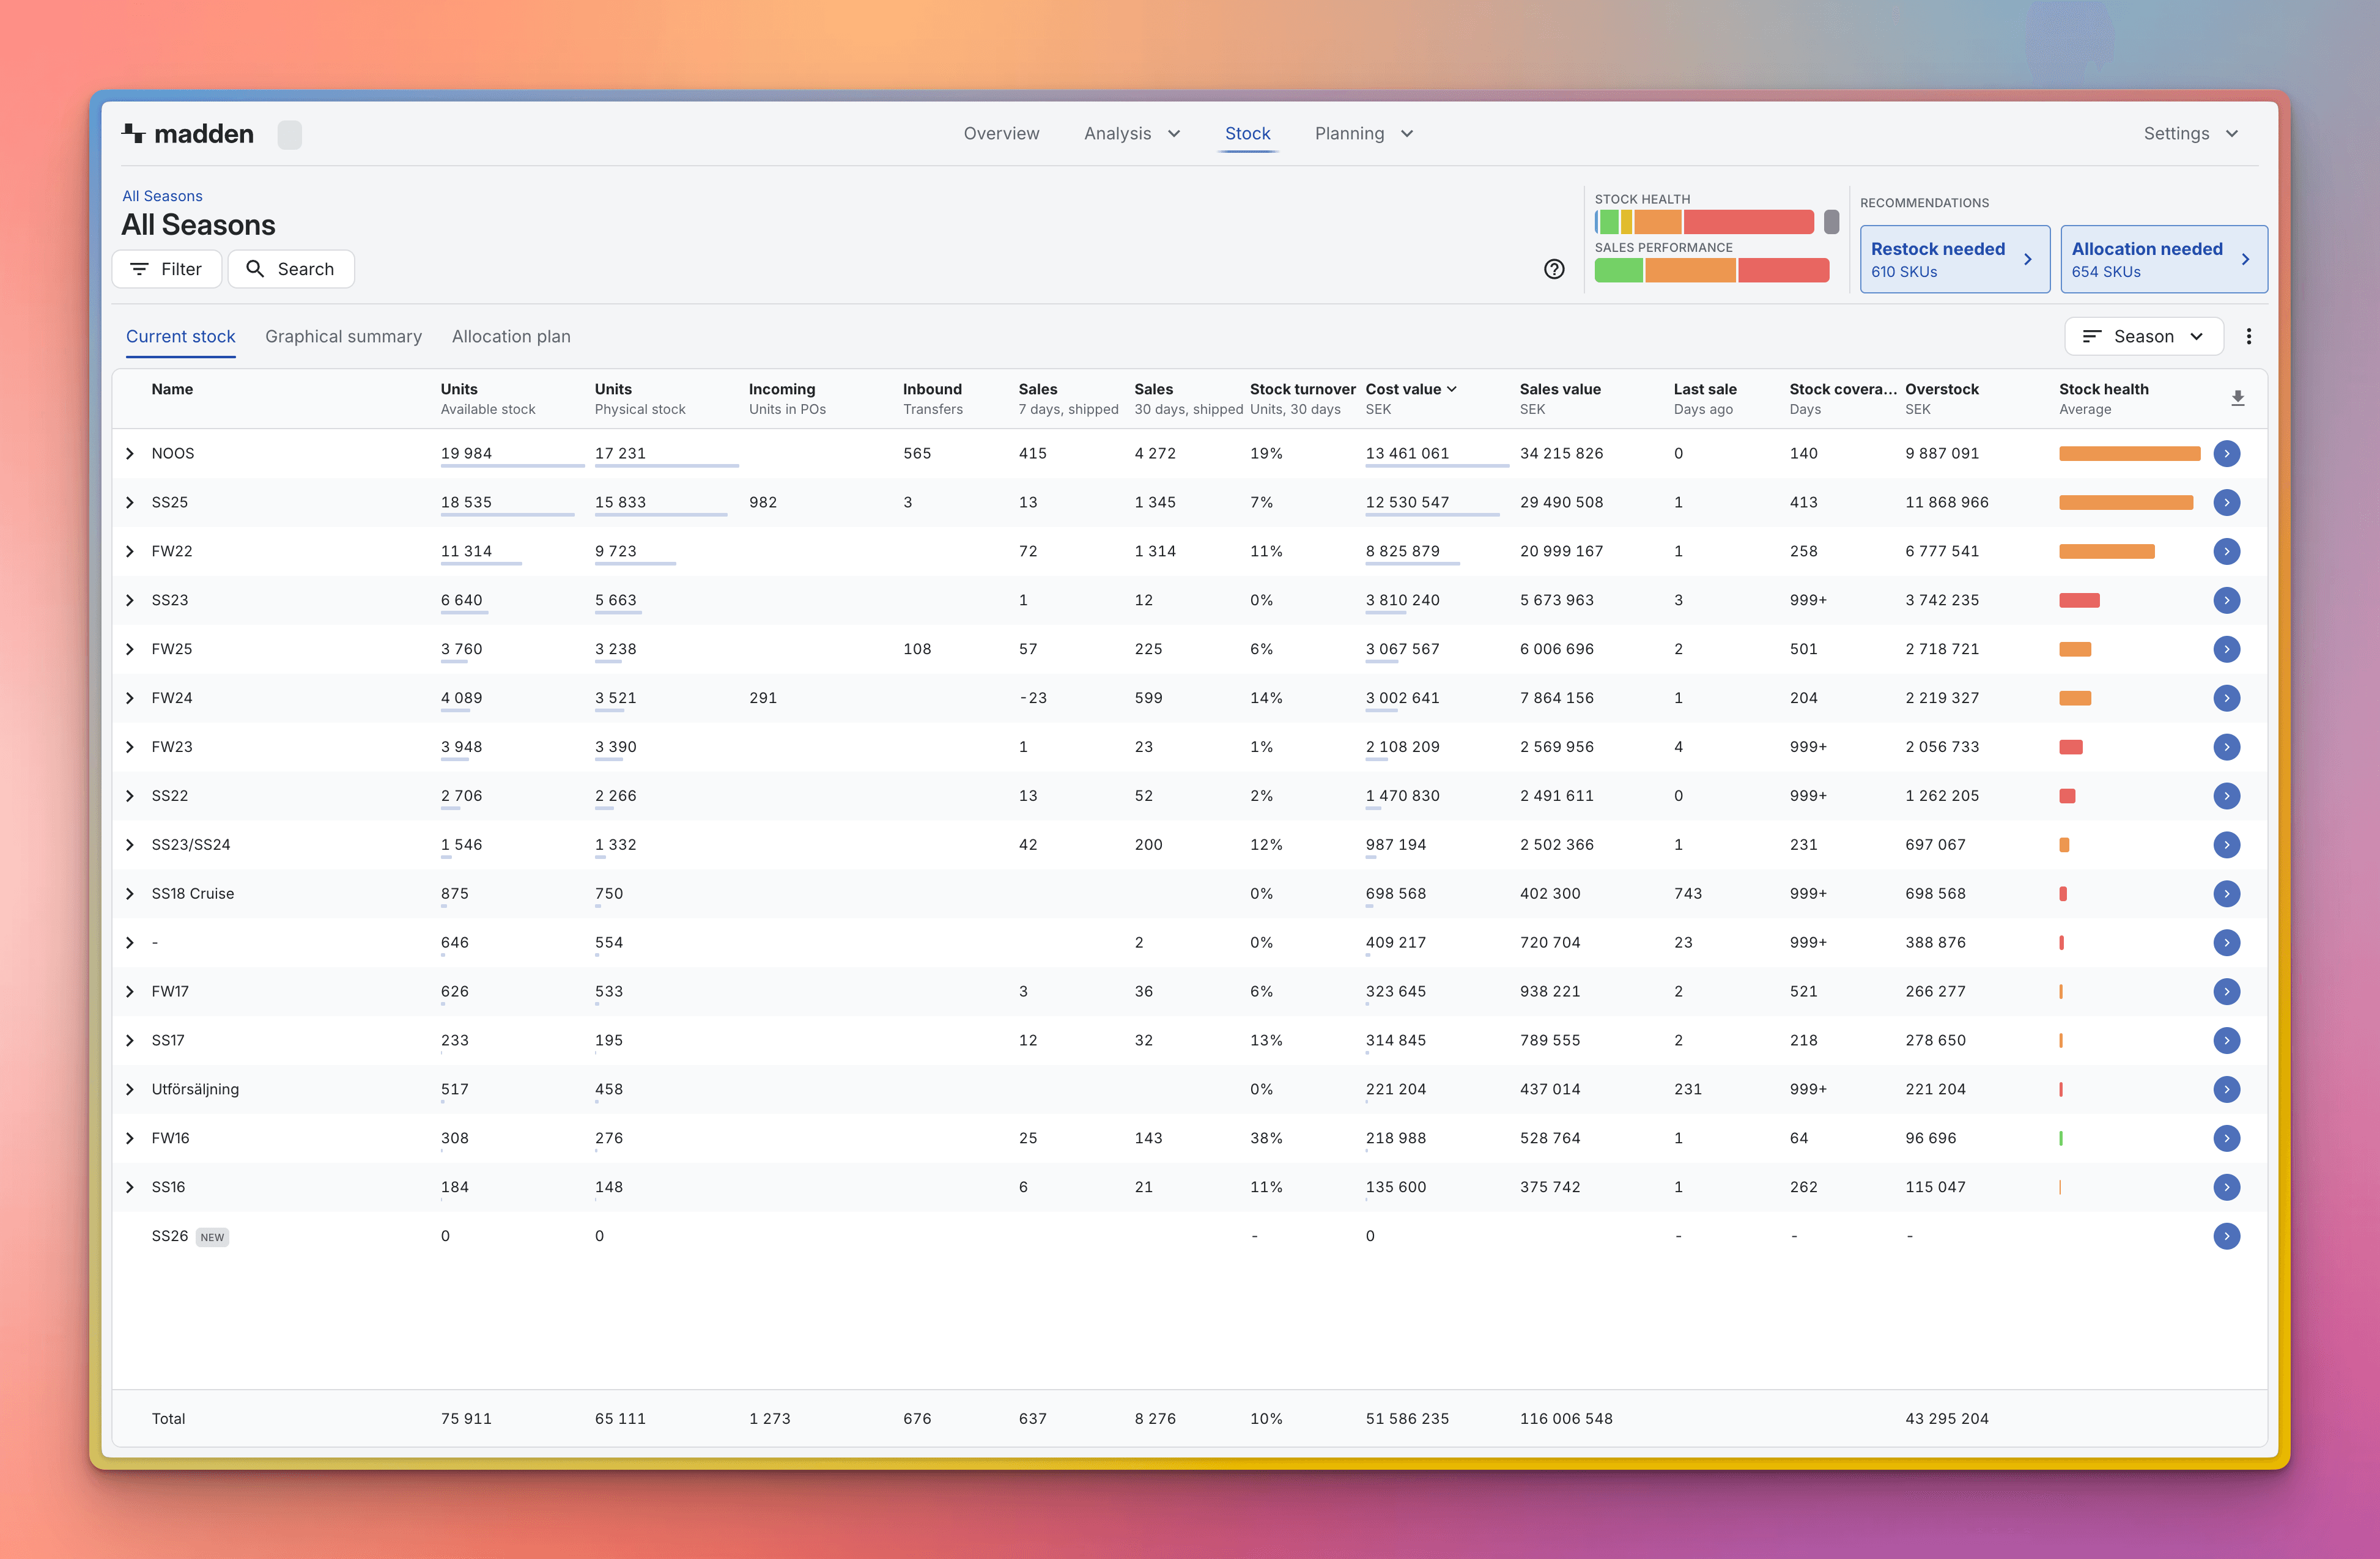
The Stock Module is Madden's core tool for managing and analyzing your inventory. It provides a real-time, comprehensive view of where your stock is, its current value, and how long it is expected to last based on projected demand.
You can use the module for high-level monitoring, or drill down into the product hierarchy to diagnose inventory issues at the SKU level.
Navigating and Analyzing Your Stock
Use the Hierarchy to Drill Down: The table initially displays data at your top hierarchy level (e.g., Collection or Brand). Use the blue arrow next to any name to drill down into the next level.
You can also select another grouping in any view by toggling between the different Group by options in the box above the table.
Tip: Drilling down helps you isolate stock issues. For example, you can start at the Brand level, identify a problematic Collection, and drill down to see the specific Style or Variant that is understocked.

Filtering for Targeted Analysis: Use the filter panel on the left to focus your view and answer specific business questions.
Location: Filter by specific Warehouse or Store to analyze regional stock health.
Stock Categories: Filter by Warehouse Type (e.g., Non-sellable or Transit) to analyze stock that is not available for immediate sale.
Key Stock Metrics
The main table displays crucial metrics that define the health and status of your inventory.
To customize which metrics are visible, click the three dots (⋮) above the table to the right to access column settings, where you can choose to add or remove more metrics.
Metric | What it Tells You |
Stock Quantity (Physical or Available) | The total number of units currently in the selected location(s). |
Stock Value | The current cost value of the stock, using each SKUs cost price. |
Coverage Days | The estimated number of future days this stock quantity will last based on your demand forecast. |
Inbound | Quantity of stock expected to arrive (e.g., from purchase orders or internal transfers). |
Product Classifications: Quick Segmentation
Product Classifications are visual labels that appear in the Stock Module, allowing you to quickly segment and understand product performance. There are two key classifications, both of which are fully customizable:
Stock Health: Labels products based on stock turnover, defined as the share of stock sold over the last 30 days (e.g., High, Medium, Low Turnover).
Sales Performance: Labels products based on their contribution to overall net sales over the last 12 months.

To learn how to customize these labels, and sales thresholds, refer to our guide: [Link to Product Classifications Article].